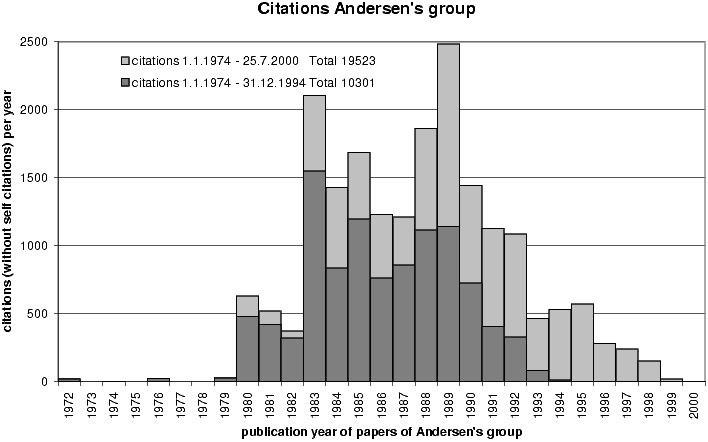
In the figure we have displayed the number of citations to the papers published by our group in a given year, as a function of the year of publication. The light-shaded (dark-shaded) columns give the citations collected until mid 2000 (end 1994). The number of citations collected by each individual paper is available for the period 1974-2000. It should be noted, and is illustrated by the visible part of the light-shaded columns, that highly cited papers collect their citations over decades. Therefore, the number of citations given to a paper during the first years is merely a measure of the immediate reaction to that paper. For that reason, we do not quote the number of citations to the papers published during the last 5.5 years, but this number may of course be extracted from the figure, and it is not much different from the number that one might extract for the previous 6-years' period. A rough 'figure of merit' for the group would be an average number of 850 citations per year, divided by an average number of 17 scientists, thus yielding 50 citations per scientist per year. This number is unusually high, but consistent with the fact that research has been the overwhelming activity of our group.